Sign-in isn't configured on this server yet — an admin needs to set up Microsoft SSO or email sign-in in .env.
For Power BI
Your dashboards, narrated.
Drop narration into any report you've already
built. Verbaliser turns your report data into plain English and
rewrites it automatically every time a filter, slicer or cross-highlight
changes the numbers underneath. It sits with your default visuals, a
line or two under a chart, or a section of its own carrying the full
breakdown.
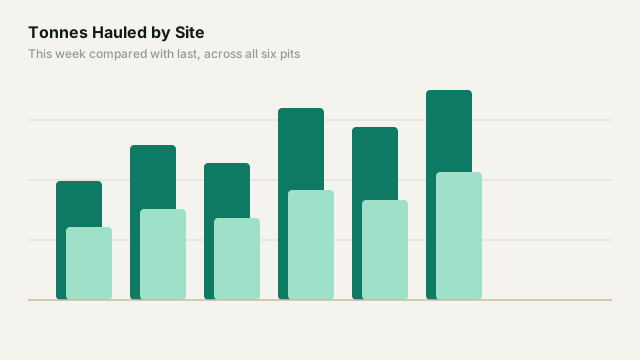
Site operations
"Tonnes hauled came to 412k for the week, 6.1% above last week. North Pit added the most, 18k tonnes, and finished 8.4% ahead of its own prior week. South Pit was the only site lower, down 3.2%. The spread between the highest and lowest site widened from 41k to 47k tonnes."
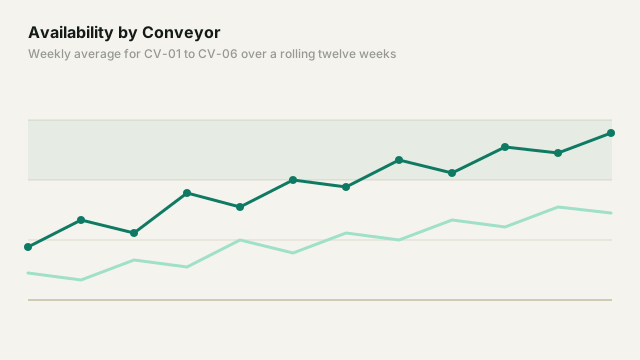
Conveyor performance
"CV-04 averaged 91.2% availability, its highest of the twelve weeks shown."
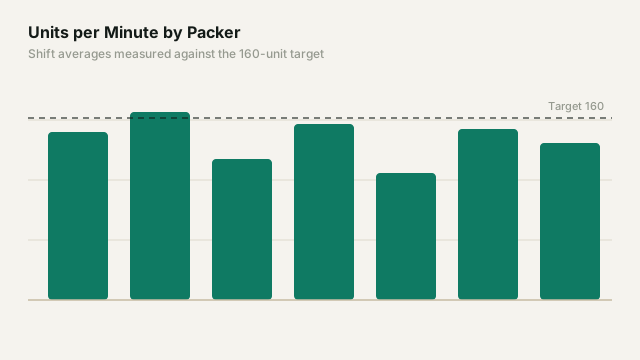
Packing line throughput
"Packer 2 averaged 148 units a minute against a target of 160, a gap of 12. Three of the seven packers finished within 5 units of target; Packer 5 was furthest from it at 48 below."
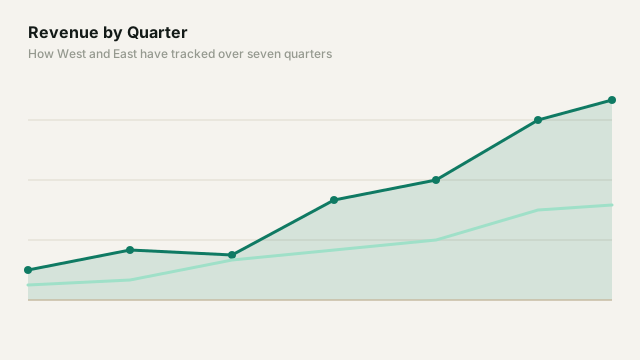
Regional sales
"Revenue reached $4.2m for the quarter, 12% above Q3. West accounted for $1.9m of the total and 71% of the quarter-on-quarter increase, while East was unchanged at $0.8m."
Supply chain & inventory
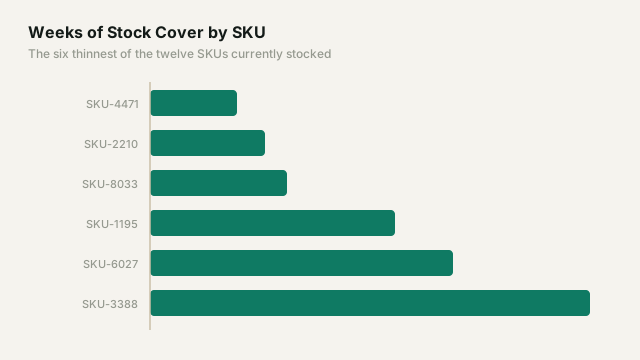
"Stock cover averages 4.2 weeks across the SKUs shown, down from 5.1 a month ago. Three sit below two weeks, the lowest being SKU-4471 at 1.2. Those same three account for 38% of units shipped over the period. Cover fell for nine of the twelve SKUs and rose for three."
Retail & ecommerce
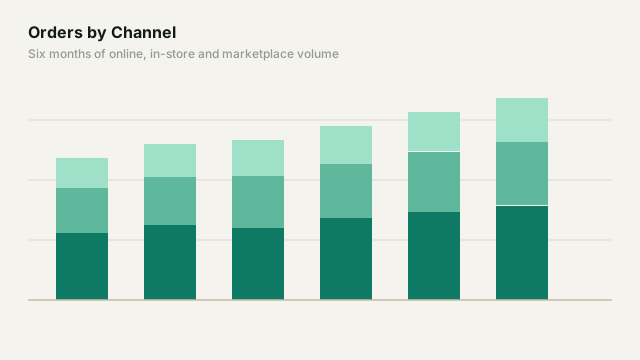
"Orders rose 9.4% on last month while the average basket fell 3.1%, leaving revenue 6.0% higher."
Marketing
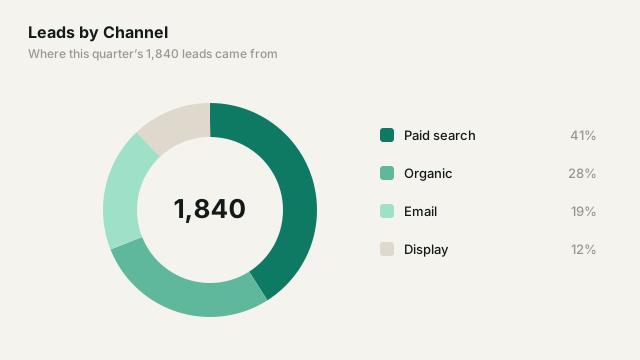
"Paid search produced 41% of the quarter's 1,840 leads from 28% of spend. Display's cost per lead moved from $38 to $79 over the last fortnight."
Finance
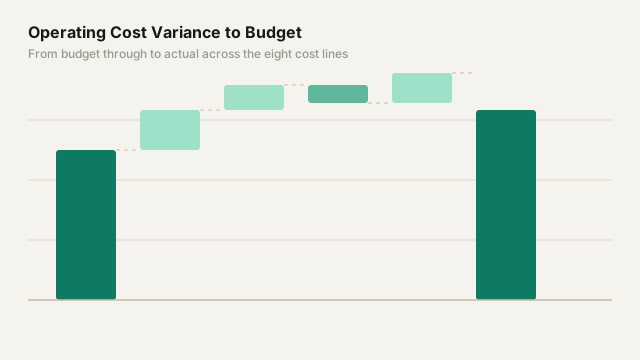
"Operating costs closed at $6.24m, 4.1% above the $6.00m budget. Contractor labour carries most of that variance at $312k against a $240k plan. The remaining seven cost lines were each within 2% of budget."
HR & workforce
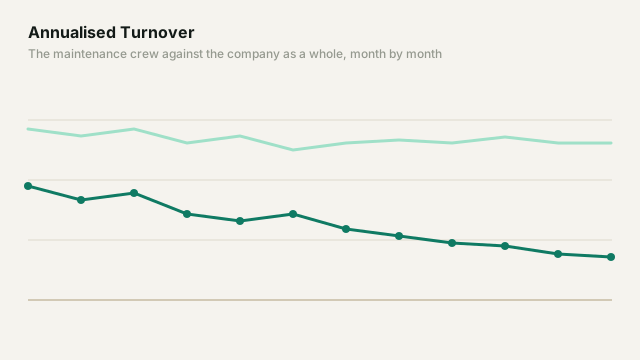
"Turnover is 11.0% annualised, down from 12.5% twelve months ago; the maintenance crew is the highest of the six at 19.2%."
Safety & compliance
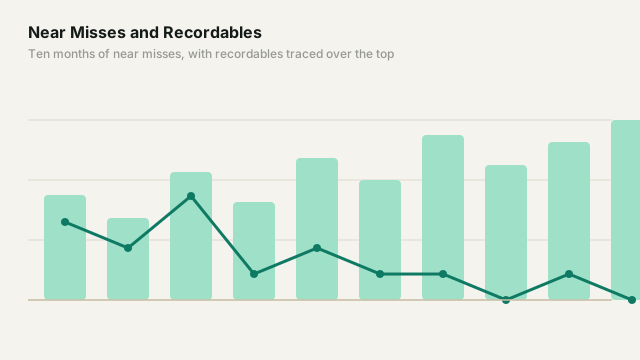
"Twelve days have passed without a recordable incident, the longest run in the period shown."
Energy & utilities
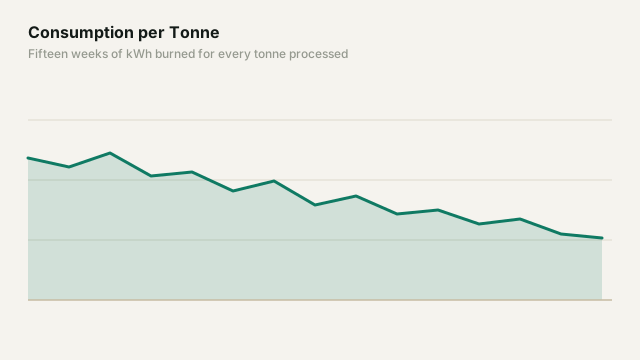
"Consumption averaged 84 kWh per tonne, 5.2% below last quarter. The crusher circuit accounts for 61% of the reduction."
IT & SaaS
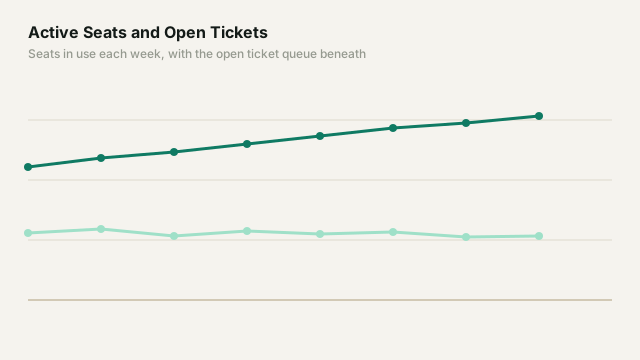
"Active seats grew 7.3% to 166, while open tickets stayed between 57 and 64 all month. First response averaged 2.4 hours against a 4-hour commitment."
Healthcare
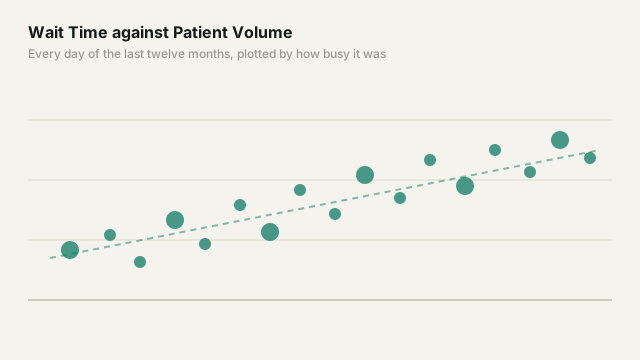
"Average wait time was 27 minutes, down from 31 and the lowest of the twelve months shown. Patient volume over the same period was 4.2% higher. Wednesdays average 41 minutes, 14 above the overall mean."
Projects & delivery
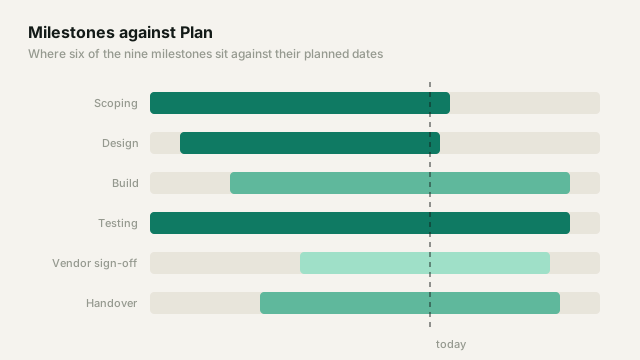
"Six of the nine milestones sit on or ahead of plan. The two furthest behind are vendor sign-off at 18 days and testing at 9."
First narration free · Encrypted at rest · Sign in with Microsoft or a one-time email code
Bring your dashboards to life
First narration free — sign in and build your first one in a couple of minutes.
There are two ways a narration reaches a reader: inside the
Verbaliser visual, where it is generated, or through the DirectQuery
feed, which carries that same text back into your model as an
ordinary table. They behave differently once the report leaves your
screen.
Verbaliser visual
DirectQuery feed
What it is
A custom visual that generates a narration from the fields bound to it.
A Postgres table of the narrations the visual has already generated, one row each. It never generates anything itself.
Where the narration appears
Inside the visual's own box.
Anywhere a field can go: a card, a visual's title, a text box, a tooltip, a table column.
When the narration updates
Automatically, whenever the data bound to it changes — a refresh, a slicer, a cross-filter.
When the report's queries run again — a manual refresh, or automatic page refresh.
Exports and subscriptions
Not included. Power BI renders only certified custom visuals into PDF, PowerPoint and subscription email, and Verbaliser is not yet certified.
Included — by then it is a field like any other.
The DirectQuery feed connection
Get Data > PostgreSQL database. Paste in the Server and Database above.
Data Connectivity mode: DirectQuery. Import works, but it freezes the narration at the last dataset refresh.
Credentials: Database. Not Windows, not Microsoft account — the Username and Password above.
Encryption. Leave “Encrypt connection” ticked; the server requires TLS.
Choose the outputs view in the Navigator. It is everything your account can see: one row per narration, holding its id, name, group, generated text and the time it was last refreshed.
Publishing to the Power BI Service. Set the semantic model's credentials once under Settings > Data source credentials, using the same username and password. No gateway is needed — the server is on the public internet, not behind your firewall.
Usage
Billing
—
Docs
These pages describe how Verbaliser is built and operated today, for
security and procurement review, at the level of what is true rather
than how it is built — ask us for anything they don't cover. The
Terms and
Privacy Policy
remain the binding documents.